Are you looking for ways to measure the performance of your Agile teams and understand their delivery performance? While there are many metrics to choose from, not all of them are created equal. Additionally, the information provided online is often misleading or inaccurate. So what metrics should you use in this case?
As an agile transformation leader with over 10 years of experience, I wanted to share the top metrics that are successfully used by the organizations I consult.
Here are some of the top Agile metrics you can use to measure delivery performance:
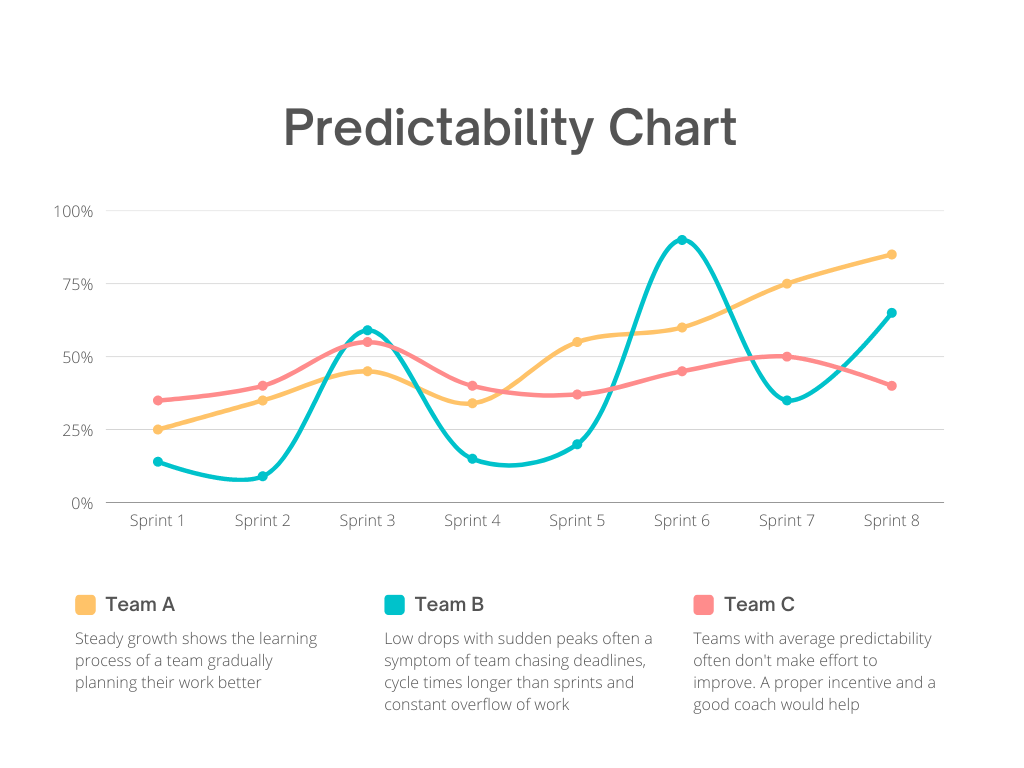
Sprint or Release Predictability. This metric measures how accurately the team is able to predict the scope of work they can complete in a given sprint or release. Predictability can help you highlight a team’s needs to improve their planning and estimation skills. However, this metric does not just indicate how well the team can plan their work, but also is the key indicator of the potential accuracy of any long-term delivery road map, and one of the indicators that affect trust between the development stream and its clients.

Sprint Backlog Variance is the Scrum metric that shows how much the team is able to focus on the work they have originally committed to. It is calculated as a percent of change to the original backlog. This is a great metric to accompany predictability and prevent team from “gaming” the predictability metric.
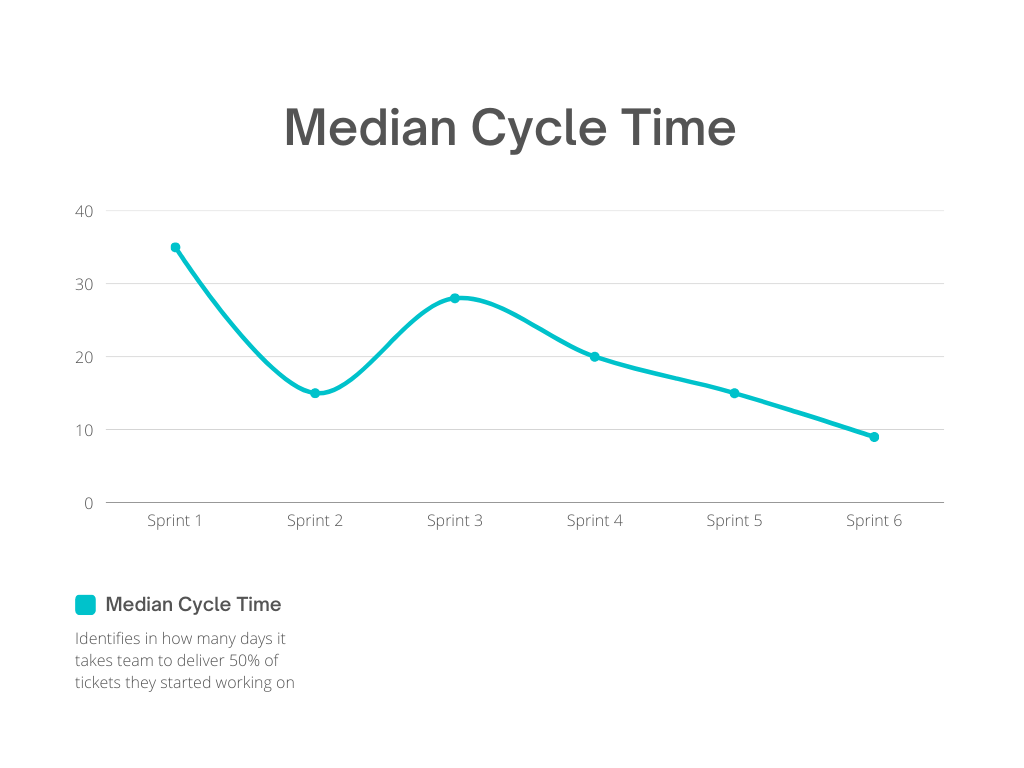
Cycle Time. Cycle time measures the time it takes for a team to complete a unit of work, typically from the moment they start work on it until it is delivered to the customer. It is a key metric in Agile and helps the team understand how long it takes to move work items through the development process.
Unlike lead time, which measures the total time it takes from the moment a request or idea is submitted until the work is completed and delivered to the customer, cycle time is focused on the actual development process and does not include any time spent waiting for approval or in backlog. Cycle time is a subset of lead time and is an important metric for teams looking to identify bottlenecks and optimize their development process. Despite a common belief that Cycle time is exclusively a Kanban metric, it is just as useful in Scrum.
Whereas Lead time is often a great metric to measure performance of fast-moving teams operating in the circumstances of high uncertainty, such as support teams, this metric is often not descriptive of the scrum teams’ success.
Cycle time is also best paired with an activity time chart, that helps to look for a root cause of a lengthy cycle time. (You could find more in the upcoming articles)

Escaped Defect Rate is calculated as a ratio of new features released to the number of defects returned to the team after each release.
Customer Satisfaction – this metric does not necessarily come from an Agile world, yet it is one of the most important metrics in the delivery process. After all, if your clients are happy, then you must be doing something right! Although, unlike others, it is a subjective metric, it goes hand in hand with the first agile principle, that says “Our highest priority is to satisfy the customer through early and continuous delivery of valuable software.” Data can be collected after each demo session and support continuous improvement discussions during a team or a release retrospective.
By tracking these metrics, you can gain insights into how well your Agile teams are performing and identify areas for improvement. However, it’s important to keep in mind that metrics are not a silver bullet, and should be used in conjunction with qualitative data and the input of the teams themselves to gain a comprehensive understanding of ways to improve delivery performance. And most importantly, metrics should not be used against the team, as it will damage both the team’s morale and trust between developers, leadership, and agilists.
Stay tuned to get more insights into each of these metrics, and learn more about agile metrics and the best ways to use them for good, and not for evil.

